


DOGEbot Test Yields 16% in 9 Days!!! — Update, Day 12
Closed at $-110+ loss, waiting it out.

Closed at $-110+ loss, waiting it out.

*This story was intended to be published last week, but Black Friday and family weekends disrupted my blogging plans*
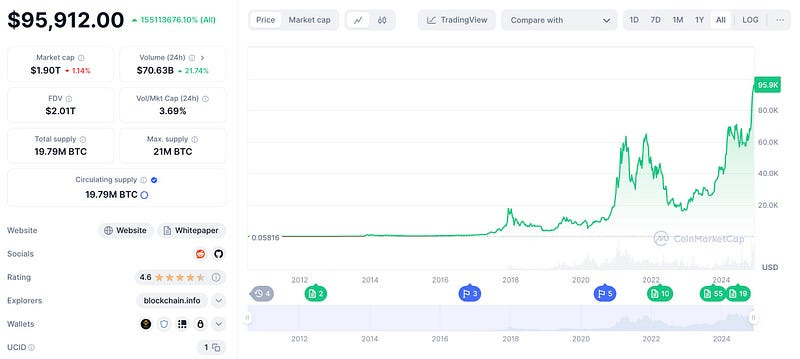
Price fell down to 96k for BTC two days ago, and I closed out of my Dogebot while it was in the red, before it dipped even more.

Doge held price staying at $0.44–46, then dipped out to $0.41–42 within a few hours of BTC dropping.
BTC has fallen further down to 91k, and Doge is now resting at $0.38.
I am holding out before I restart my bot, waiting to see how far we may dip.
I was able to minimize my losses this time by watching something and reacting a little early.
What was I watching?
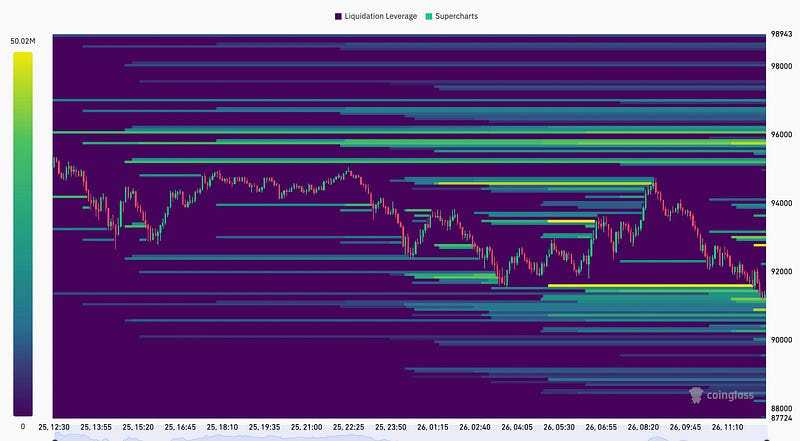
Liquidation HeatMaps
I saw the HeatMap was completely lit up right under 96k, which indicates a stronger chance of liquidations there. I decided to close when we struggled to push up and my bot was edging $-100 or so, and it proved to be the right choice.
How does a HeatMap work?
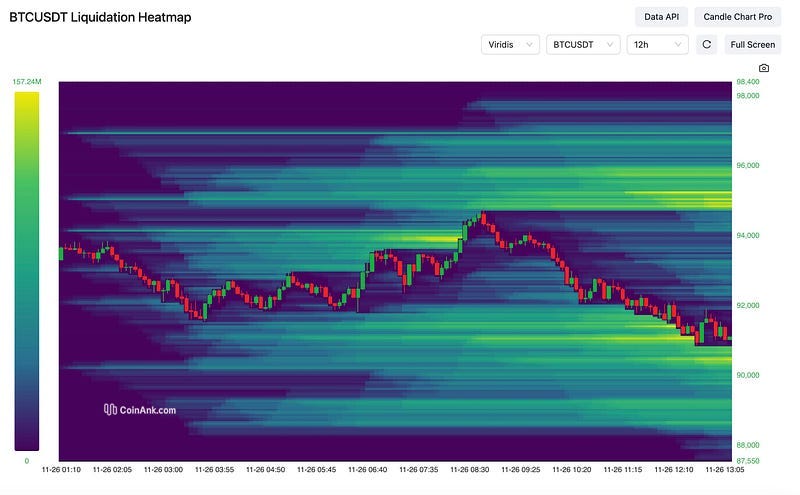
A liquidation Heatmap displays the price levels where large numbers of leveraged traders could be forced to liquidate their positions if the market price moves against them, essentially showing potential areas of significant price volatility due to forced selling pressure; the Heatmap provided by Coinank uses color gradients to indicate the concentration of potential liquidation orders at different price points, with brighter yellow representing higher potential liquidation volume at that price level.
How to read the Coinank liquidation HeatMap:
Axis:
Just like any trading chart, the x-axis typically shows the price of the asset. The y-axis in this case represents the volume of potential liquidation orders at that price level.
Color gradient:
Bright colors (red, orange): Indicate high concentrations of potential liquidation orders at that price level, suggesting a zone where significant selling pressure could occur if the price reaches that point.
Cooler colors (blue, green): Represent lower concentrations of potential liquidation orders, indicating less potential selling pressure at that price level.
Identifying key areas:
Liquidation walls: Look for vertical lines of bright color on the HeatMap, which represent price levels with a large number of potential liquidation orders, potentially acting as strong support or resistance levels.
Price triggers: The specific price points where the color intensity peaks on the HeatMap can indicate potential price triggers for large-scale liquidations.
Note : the HeatMap is not a 100% prediction:
While the HeatMap shows potential liquidation points, it does not guarantee that the price will reach those levels or that large-scale liquidations will occur. It does however seem to signal a pretty decent chance of liquidations occurring at various price levels.
When that heat intensity wanes, the market “tests” and “has resistance”.
Reading HeatMaps is proving to be an effective and useful replacement for the signal I recently lost that was working well for me earlier this year:
Crypto Whale Watching; Trading Signals — Futures Price Notifications
A curious phenomena I’ve noticed….
I am not going to re-open my squeezed-config Dogebot until we find a happy floor again.
Then as the intensity of the yellow increases, in theory, this is where sell pressure happens.
We keep hitting sell pressure in the last 3 days.
Seeing it light up yellow and get brighter and brighter quickly is now something that, based on recent observation, seems to be saying “sell, sell, sell!” or in my case, “close your bot, widen the spread!”.
Another Useful HeatMap I Just Discovered
Source: https://www.coinglass.com/LiquidationData
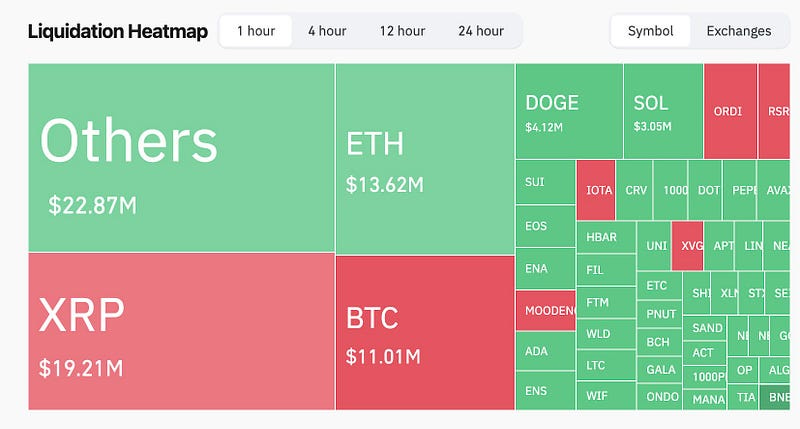
This is a HeatMap I stumbled on while searching for a Doge heatmap.
Bing!
Right now, Doge is all green, signaling that it is heavy on long positions, but it’s been wavering as much as 0.05+-, and I kind of still expect more dipping soon.
If you hover over each square, you can see the volume of shorts/longs.
You can also select by the hour, 4 hour, 12 hour, and 24 hour periods.
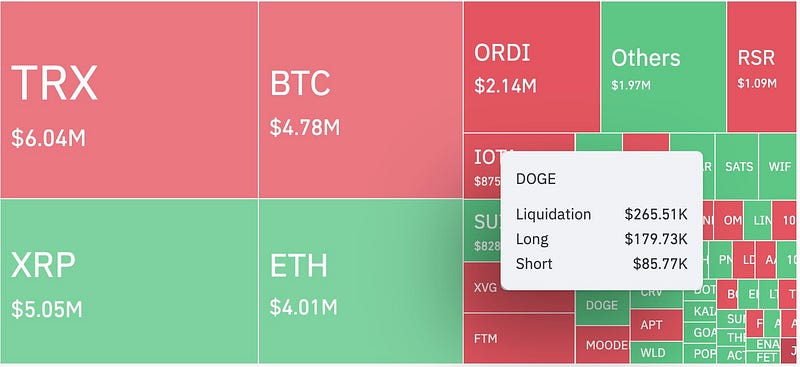
If the square is red, the coin is short-heavy, with more shorts on the order book than long orders. If the square is green, it is long-heavy, with more long positions open than shorts.
This is the easiest to read and most exciting macro analysis tool I have found so far!
It kind of shows me exactly what I wanted to know, about every coin listed on it.
When a huge volume of shorts are opened flipping the ratio by a large margin, this indicates it will be a good idea to WIDEN the spread on martingale bots, IF I am running a squeezed spread configuration.
The coin HeatMap being red doesn’t indicate that.
If there is a fairly even split, like 45% / 55%, it doesn’t necessarily mean I need to shift my bot settings.
If the ratio is more like 30% / 70%, AND I think the price percentage of the dip is going to leave my bot out of range and stalled, THEN I will alter settings.
No point in closing a martingale if its only made a few purchases and still has more purchases to go, and a decent spread covering a possible dip.

The HeatMap doesn’t necessarily indicate when it is safe to open a squeezed-spread configuration, as that is more or less only “safe” when the market is FLAT or BULLISH, and shows signs of staying that way for a period.
The HeatMap is only going to give me a better idea of when to stop my bot and widen my spread (preparing for a dip), or just sit tight and wait to see what happens.
So if Doge is currently green, why am I not restarting my bot yet?
My patience is growing, and I am basing my choice on historical data.
Historically, we see some kind of price dip at the end of the year when people sell for tax reasons or have other reasons to liquidate and make purchases.
When BTC takes a dip, it always pumps much harder downward on the altcoin universe on the way down.
This is what I lovingly refer to as “The Inverse Law of the BTC Pump” — the harder the pump for BTC, the harder the dump is on small cap Altcoins.
We can see in the price history of many Altcoins — a big BTC dip can utterly wipe out some small cap coins.
Doge might be an exception here, as it is one of the strongest caps in the market, however, it will still feel the impact of a market dip. If BTC dumps by 20%, I expect Doge to dip by 50%. (This isn’t exact math, it is to say….right out of my arse…..but an educated arse-grab nonetheless)
So when and if this dip happens soon, even if BTC manages to stay about $70,000, I kind of expect Doge to fall back to 0.20–25.
I need to be very careful here if I am going to restart a squeezed-spread martingale bot for Doge, because I could just end up having to wait out the next dip.
“Disclaimer : This is not financial advice and I am not a financial advisor. This is just what I am doing with my own money. I am NOT an expert. I am some dude on the internet who sees a path sometimes, and takes it.”
Thank you for reading!
Until next time….
Onward and Upward Everybody!
-Chris
A.I. Lifestyle
A few years ago I automated my primary online business to the point where it only takes me a few hours per week, and…www.youtube.com
#tradingbots #doge #dogebot #trading #crypto #cryptocurrency #tradelife #botlife