


Beginner’s Guide to Crypto Trading Bots — Part 19 — Analyzing Moving Averages
It doesn’t have to be rocket science.

It doesn’t have to be rocket science.

Calculating Moving Averages
The average price movement of an asset during a specified period of time is called the moving average. It’s value is expressed as a percent of the total asset value, with a given time period. “Bitcoin value increased by 3% today!” “Bitcoin crashed by 20% this month!”.
When I first started trading, this was the most intimidating part of the process. I assumed that this would require years of experience and be so mathematically complicated that I might never really figure it all out.
Being a wizard with predictions was what separated seasoned lifelong professional traders from people like me who had no idea what they were doing. That is what I told myself.
Luckily for me, I was totally wrong!
Like almost everything, price analysis and learning to respond to it can be broken down into smaller pieces and the concepts begin to make much more sense. Take it slow, break it into chunks, get better with it over time.
Before we get started — if you refer back to Chapter 4 on Bot Configuration, the new “AI Strategy” configuration attempts to do this job for you nowadays and if you wanted to, you could run on AI Strategies and just stop/restart the bot with new AI generated settings every few days, every few weeks, etc, taking 90% of the brain work away from you.
And if AI powered trading keeps going, eventually I might just rest my brains on a shelf and let the bots do everything too, as I am sure at least a handful of very accomplished programmer/traders are doing right now, but until then…..
It would be good to understand what your bots are doing and why. The biggest part of that is being able to understand how to get actionable values from price charts and respond to that.
For price analysis, my favorite website is CoinMarketCap.com, but there are numerous others to choose from. I find the price charts on that website easy to move and zoom and analyze.
The top branches of of the price analysis tree are :
The Day Chart
The Week Chart
The Month Chart
All platforms that catalog price history data will give the option to arrange the data in these time frames.

These three time periods are most of what you will consider when trying to optimize your bot settings to maximize profit. They are the most relevant to the price of the coin as it is the current and recent past.
Going further down the trunk of price tree we find:
1 Year Chart
Multi-Year Chart
All Time
These charts are also important to consider because they give you a better idea of the longer term stability and volatility profile of the coin you are examining.
These timeframes will give you a better idea of what happens to the coin price year after year, and the status of the coin since it’s launch. Sometimes you will notice yearly patterns you can act on!
So, how to I turn price history into action?
First, you need to note the highest price and lowest price for the day, then the week, then the month, then calculate the total percentage of price movement in those periods.
So if Bitcoin’s low price today was $65000, and it’s high today so far is $65700, we subtract to get the difference — which is $700. We then calculate the percentage. I do this mentally, which is not accurate to the decimal, but it doesn’t need to be. I use mental rounding, but if you prefer you can be exact and use a website like https://www.percentagecal.com where you can enter “700” is what percent of “<insert Bitcoin price>” and you get an easy fast answer.
Mental Rounding Example:
If 1% of 70,000 is $700, then 700 would be about 1.1% of $65000. (1.08%, to be exact). Not a huge difference.
So I round it and say the moving average for today is 1%.
Now let’s do the same for the week chart. Let’s say the low for the week was $63300, and the high was $65700.
That moves the spread range to $2400, which makes the moving average for the week about 3.5% total.
$700 x 3 = $2100, which is 3%, + $300 = $2400.
$300 is a little less than 50% of $700, so 0.5%.
All factored, about 3.5% total moving average.
All that happens in my head now pretty fast. If your own head doesn’t do that kind of thing on the fly at first, then it’s best to use the websites and calculators and get the proper values. You can still round the values once you get them.
Now do the same for the Month Chart. Let’s cut past the calculations and just say the moving average was 12% for the month.
Now look at the price movement itself. How jagged are the charts?
Is this price relatively steady and smooth? Or is it indicating high volatility within the current price range?
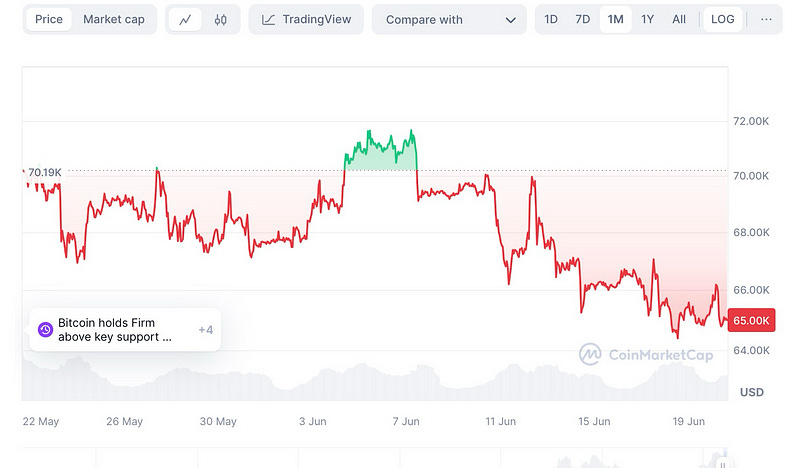
Pretty volatile in the chart seen above.
Now it’s time to decide if you want to tailor your bot to capture the daily swings, or go a little wider in your spread to capture the bigger swings across a longer time period. If highly volatile, I find it almost irresistible to try to capture some profit on it.
If you want to capture the daily flux better, you might squeeze your total spread to 3% or less. But that would be focusing on the day chart only.
Zooming out and seeing that the average daily price movement is 1–2% while the last few months have moved anywhere from 4–12% might inspire you to create a bot with a 5% spread, and seeing that the chart is very jagged (volatile) and might be prone to jump out of range if you set the spread too thin. You’d leave this bot running with expectation of prolonged profit capture during the week.
There are more advanced ways to read price action, such as understanding and profiling price “candlestick patterns”, but those methods are beyond this book.
My bot configuration adjustments and spread choices are often based on mental averages and rounding, meant to be very short term while I am active in tending to my bots and responding to them. If I am going to walk away and not monitor my bots for a while, either going on vacation or if I just have other things to do, I will configure my bots accordingly. Rarely do I have a reason with my personal strategy to calculate exact percentages.
See : “Set it and Forget It” vs Semi-Automated Trading”
Continue to the Next Story in this series:
Beginner’s Guide to Crypto Trading Bots — Part 20— Parallel Testing

Time to fine tune your automated income.
Thank you for reading!
Until next time….
Onward and Upward Everybody!
-Chris
Automated Income Lifesyle w/ Chris Morton YouTube
#lifestylebots #botlife #livingbots #vampiretradingbot #thebotlife #getit